

Data Engineering & Analytics for eCommerce
Data engineering for eCommerce means connecting a brand's store, CRM, ERP, marketing, finance and logistics systems into unified pipelines and dashboards, so data drives decisions instead of sitting unused in separate tools. URich builds these pipelines and warehouses and the BI dashboards on top of them for D2C and multi-channel brands.
Our Data Engineering & Analytics services transform scattered data into a single source of truth, enabling smarter decisions, automation, and long-term scalability.
- Full data engineering team
- Brand data platforms & unified data lakes
- Powerful ETL/ELT pipelines
- Machine learning–ready architecture
- BI dashboards for leadership teams
- Integrations with Shopify, CRM, ERP, marketing tools & warehouses
Why eCommerce Brands Need Data Engineering & Analytics
Most brands struggle with:
- Data living in disconnected systems
- No unified analytics or dashboards
- Manual reporting in spreadsheets
- Inconsistent metrics across teams
- Poor forecasting & weak decision-making
- Lack of visibility into marketing performance
- Hard to track profitability by product/region/channel
- Slow operations due to missing data
- No data governance or versioning
- Challenges scaling into new regions or channels
Data chaos → bad decisions → lost revenue. Our job is to fix the chaos.
What Clean, Integrated, Trusted Data Gives Your Business
With a unified data ecosystem you get:
- Stronger and faster decision-making
- Real-time dashboards for management
- Automated reporting (daily, weekly, monthly)
- Improved forecasting accuracy
- Lower operational costs
- Clear visibility into profitability and performance
- Data foundation ready for AI & machine learning
- Higher marketing ROI
- Scalable data architecture for long-term growth
Clean data is a strategic advantage. We help brands build it.
Data Engineering & Analytics Services
-

Building a Brand Data Platform
Create a unified data lake/warehouse that centralizes all business data.


-
ETL/ELT Pipelines
Automated data ingestion, transformation & orchestration at scale.
-
Dashboards for Management
BI dashboards for founders, C-level, marketing, finance & operations.
-
Data Analytics
In-depth analysis, insights, reporting & business recommendations.
-
Data Engineering
Infrastructure, pipelines, modeling, data lakes & warehouses.
-
Business Intelligence Services
BI strategy, dashboards, reporting, KPI systems.
-
Data Integration
Connecting all tools, APIs, warehouses & cloud systems into a unified ecosystem.
Data Engineering & Analytics Use Cases for eCommerce
- CAC & ROAS analysis
- Attribution modeling
- Customer segmentation
- Subscription analytics
- Campaign performance dashboards
- Product profitability
- Variant-level performance
- Collection heatmaps
- Inventory forecasting
- Return & defect analytics
- Inventory turnover
- Warehouse performance
- Reorder triggers
- Supplier performance
- Revenue & margin breakdown
- Cash flow forecasts
- Profitability dashboards
- Cost of goods (COGS) modeling
- Customer journey analytics
- Ticket volumes & CSAT
- Churn analysis
- Retention cohorts
How Data Engineering & Analytics Drive Revenue & Efficiency
Increase Revenue Through Data-Driven Decisions
Predict trends, optimize pricing, improve customer acquisition & retention.
Reduce Costs Through Automation
No more manual spreadsheets - everything updates automatically.
Improve Forecasting Accuracy
Better inventory planning reduces stockouts & overstocks.
Optimize Marketing Spend
Identify winners, drop waste, scale what works.
Align Teams Around a Single Source of Truth
Everyone sees the same numbers - no confusion.
Build a Foundation for AI & ML
Clean structured data → AI automation becomes easy.
Increase Revenue Through Data-Driven Decisions
Predict trends, optimize pricing, improve customer acquisition & retention.
Reduce Costs Through Automation
No more manual spreadsheets - everything updates automatically.
Improve Forecasting Accuracy
Better inventory planning reduces stockouts & overstocks.
Optimize Marketing Spend
Identify winners, drop waste, scale what works.
Align Teams Around a Single Source of Truth
Everyone sees the same numbers - no confusion.
Build a Foundation for AI & ML
Clean structured data → AI automation becomes easy.
Technology We Use to Build Data Platforms
Data Warehouses
-
 BigQuery
 - Snowflake
- Redshift
- PostgreSQL
- DuckDB
ETL/ELT Tools
- Airbyte
- Airflow
- dbt
- n8n
- Fivetran
- Custom Node.js/Python pipelines
BI & Dashboards
- Looker Studio
- Power BI
- Metabase
- Tableau
- Superset
Cloud & Infrastructure
- GCP
- AWS
- Azure
- Hetzner
- Cloudflare
Integrations
- Shopify
- WooCommerce
- Magento
- HubSpot
- Zoho
- Salesforce
- ERP systems
- PIM/DAM/OMS/WMS
- Klaviyo & marketing tools

How We Build Your Data Ecosystem
Data Audit & Strategy
Analyze all your systems, KPIs, metrics & data needs.
Architecture Design
We provide a complete data ecosystem: Warehouse, Pipelines, Models, Dashboards, Integrations, and Governance.
Data Platform Setup
We build high-performance architectures using Data Lakes, ETL/ELT pipelines, and strategic Data Models.
Dashboard Development
We design executive and operational dashboards for leadership and specialized departmental teams.
QA & Validation
We ensure data integrity through high accuracy, metric consistency, and dashboard reliability.
Deployment
Live rollout + staff onboarding.
Ongoing Support
Monitoring, optimization, and new dashboards on demand.
Why Brands Choose URich for Data Engineering & Analytics
- Full in-house team: data engineers + analysts + ML experts
- Deep understanding of eCommerce, D2C, beauty, fashion, supplements
- Experience building data lakes & real-time pipelines
- Strong integration with Shopify, CRM, ERP, marketing tools
- End-to-end delivery: strategy → engineering → dashboards → insights
- Ability to evolve into AI/ML automation
- Fast delivery using modular architecture
- Ongoing support & optimization
- Accuracy, reliability & enterprise security
We don’t just visualize data - we build your entire data infrastructure.
Case Study - Building a Full Data Platform for a Global Beauty Brand
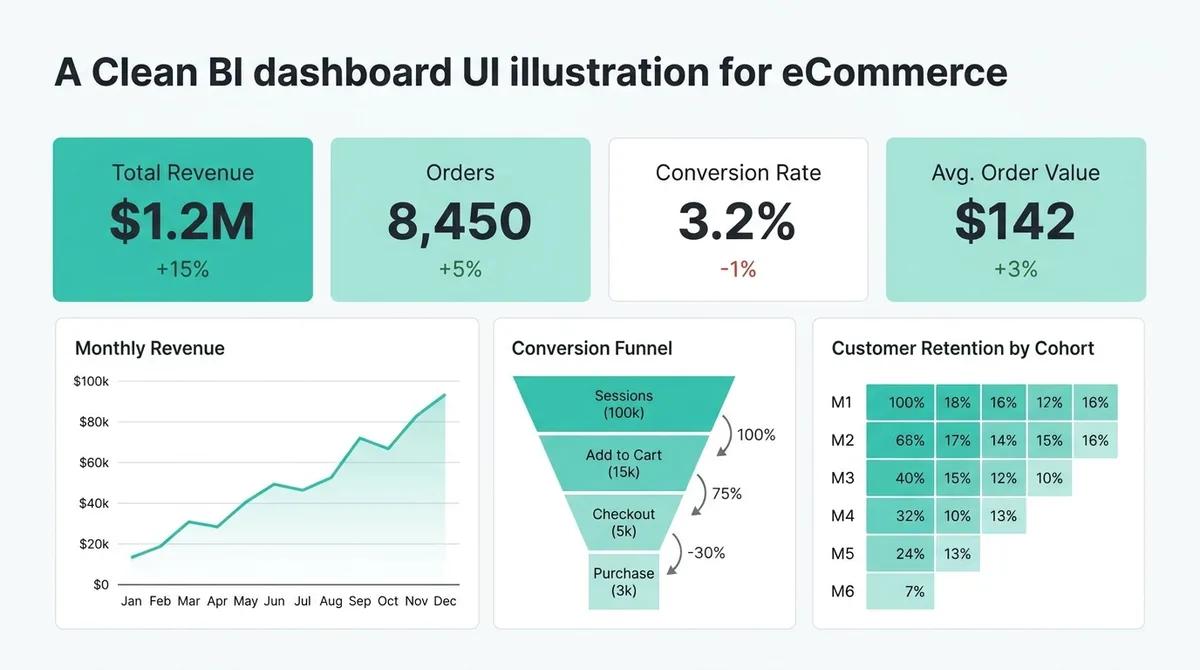
Illustrative dashboard - the reporting structure we typically deliver; client data stays confidential.
Related real-world project: Exchanger - real-time financial data platform across branches
Challenge:
Data lived in Shopify, Magento, CRM, ERP, Excel, marketing tools - no unified analytics.
Solution:
- Built a full data lake
- Connected Shopify, CRM, ERP, Klaviyo, support systems
- Automated ETL pipelines
- Created dashboards for management
- Built profitability, retention, and inventory models
Results:
- +40% faster decision-making
- -70% manual reporting
- Unified metrics across all departments
- 12+ automated dashboards
- Foundation built for ML & AI systems
Data Engineering & Analytics - FAQ
No. Small datasets are actually the best time to set up clean pipelines - you fix tracking and modeling before bad data accumulates. We design the architecture to scale from thousands to millions of events without rework, so early-stage brands get trustworthy numbers now and a foundation that grows with them.
Yes. We ingest Shopify data - orders, customers, products, events - into your warehouse alongside marketing and operational sources, including multi-store and multi-region setups with currency normalization. That gives you cross-store reporting Shopify's native analytics can't produce, and a single source of truth for finance and marketing.
A focused implementation - warehouse, core pipelines, first dashboards - takes four to six weeks. Full builds with multiple data sources, modeling layers, and department-specific reporting run eight to twelve weeks. We ship in increments, so you get usable dashboards within the first month rather than waiting for the whole system.
Yes. We migrate existing dashboards from Looker, Power BI, Tableau, and other BI tools - preserving the metrics your team relies on while fixing definitions that drifted over time. Migration is also the natural moment to consolidate duplicate reports and document metric logic so numbers stop varying between tools.
Yes. Beyond the initial build we offer ongoing analytics support: pipeline monitoring, new report development, metric reviews, and a monthly insights readout that turns data into decisions. Retainers are sized to your stack - most clients start small after launch and scale hours as reporting needs grow.
Yes. We connect ERP and CRM systems - alongside your store, ad platforms, and support tools - into one warehouse model, so margin, inventory, and customer-lifetime metrics reflect the whole business rather than one silo. Standard connectors cover the major platforms; custom APIs handle the rest.

Timeline & Budget
| Data audit & architecture | 1-2 weeks |
| Warehouse + pipelines | 4-10 weeks |
| BI dashboards | 2-4 weeks |
Budget: individual estimate after a free discovery call - you get a transparent scope before any commitment.
Free data audit
Send your stack (store, analytics, CRM) - we'll flag the gaps between the numbers you have and the numbers you can trust.
Ready to Turn Your Data Into a Powerful Revenue Engine?

Let’s build a modern data architecture
that enables smarter, faster decisions.

