

Drone Inspection & IoT Analytics Platform for Industrial Infrastructure
A data-driven platform that transforms drone inspection and IoT data into actionable insights for industrial infrastructure monitoring
Measured post-launch vs. the previous period - GA4 / Shopify Analytics.

THE CLIENT
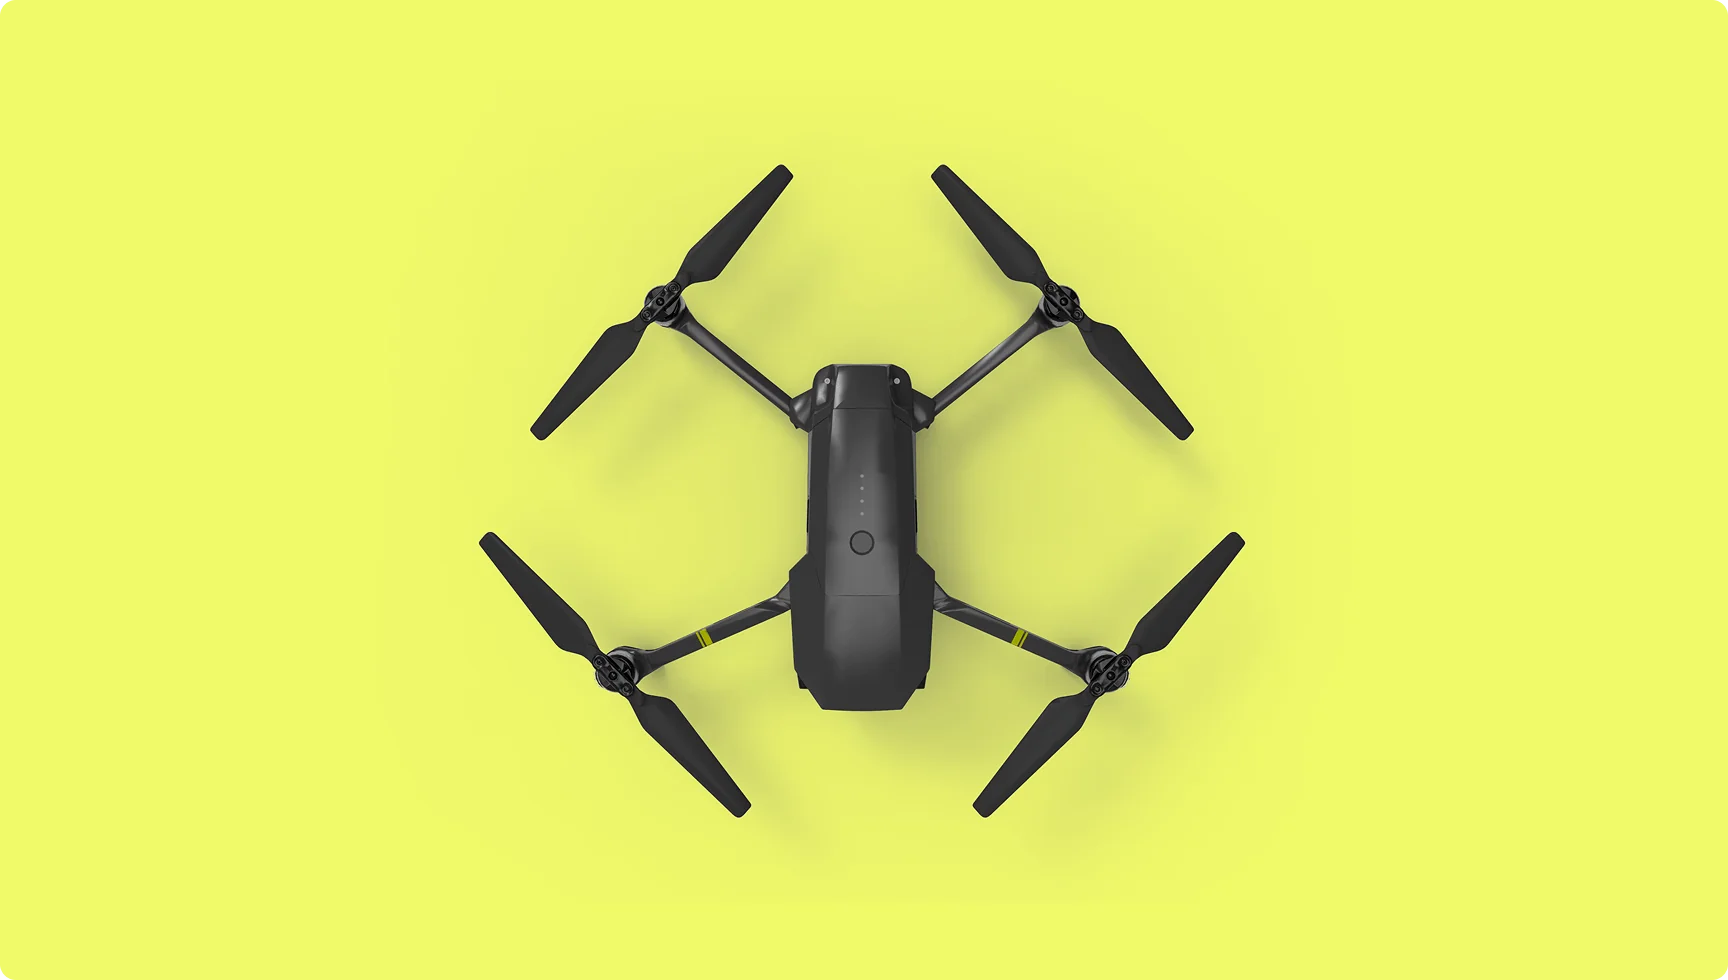
Skynexa is a global inspection and analytics company that uses drones to perform visual and thermal audits of complex infrastructure - from offshore platforms to industrial facilities.
The goal was to create a digital platform that transforms raw inspection data into a structured, accessible system for decision-making.
PROBLEM SPACE

Complex Data, Low Accessibility
Inspection data (images, thermal scans, reports) is inherently complex. The challenge was to make it understandable for non-technical stakeholders
Multi-Asset Management
Clients operate multiple facilities across locations - requiring a centralized system to manage and compare data
From Data to Decisions
Raw visuals don’t create value on their own - users need structured insights to assess asset condition
Cross-Environment Usage
The platform had to work for both field teams and management - with different expectations and use cases
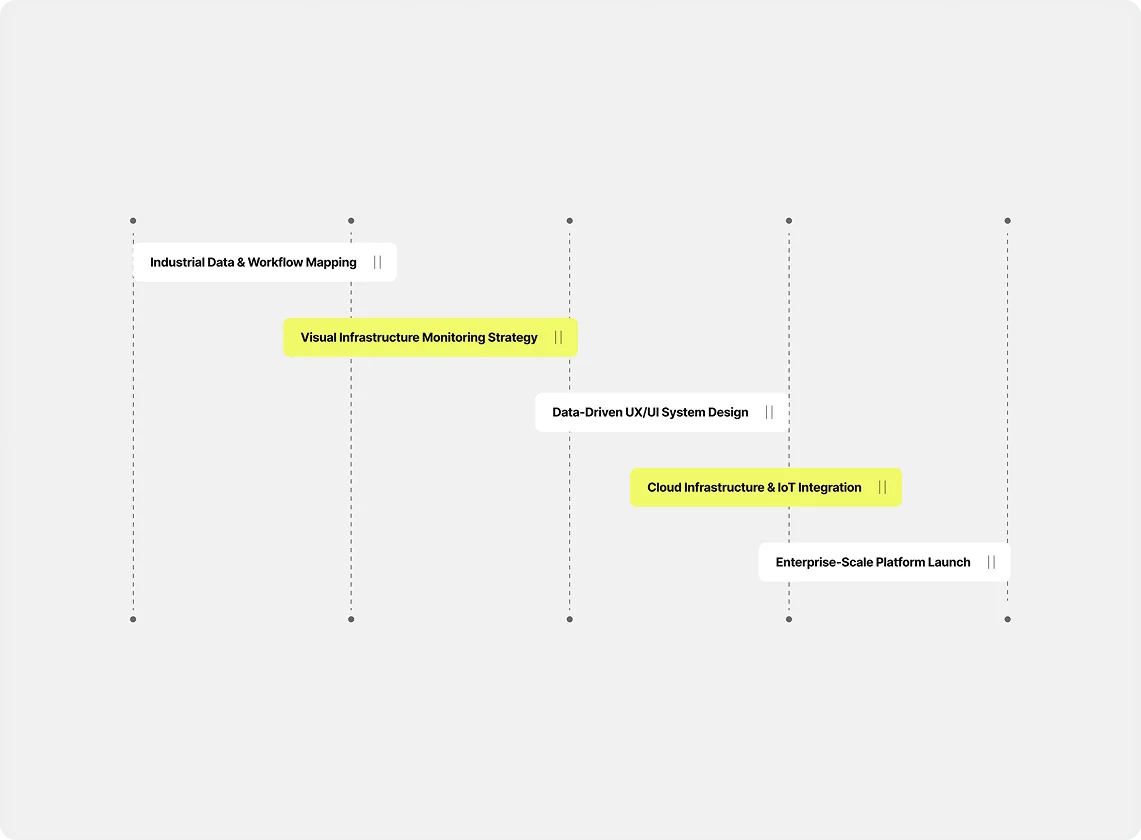
WHAT WE DID
Data Visualization Platform
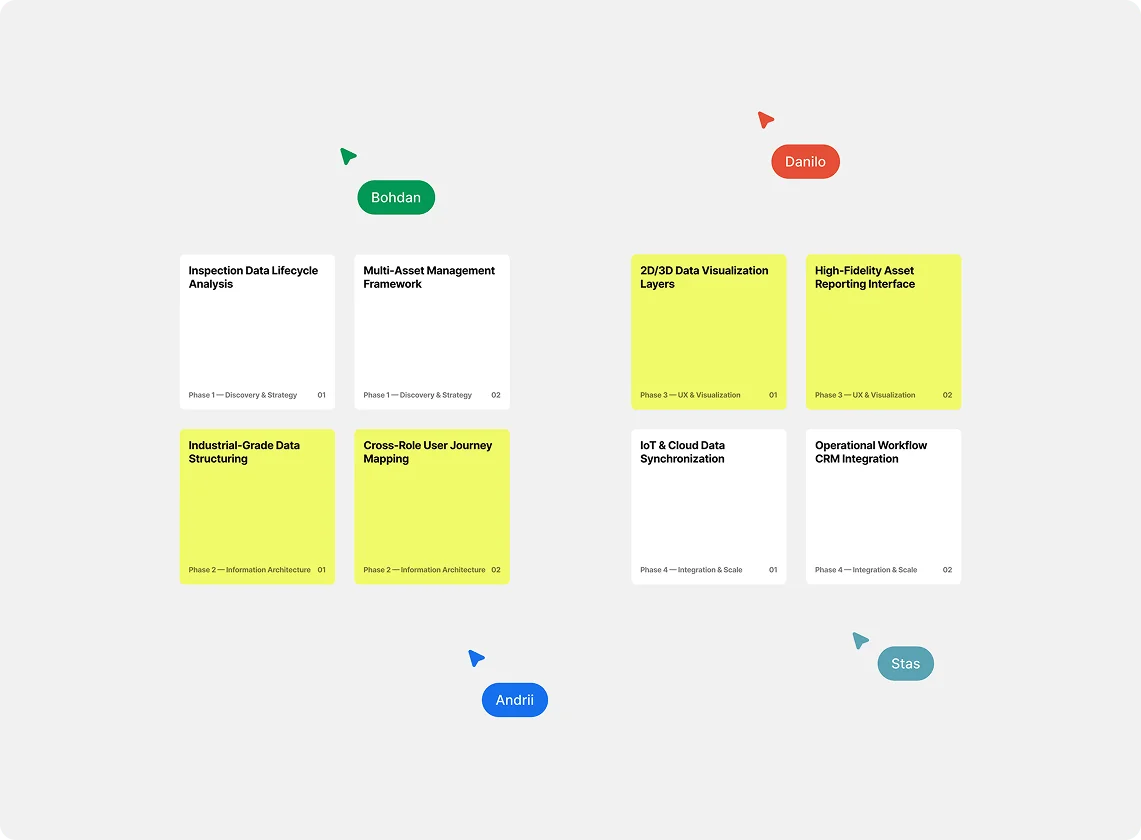
Designed an interface that transforms inspection results into structured, navigable insights - including 2D/3D visualization layers
Centralized Cloud System
Created a unified platform where all inspection data is stored, managed, and shared across teams and stakeholders
UX for Complex Systems
Simplified interaction with large datasets - allowing users to quickly move from overview to specific asset details
Integration Layer
Ensured compatibility with IoT systems and external data sources, enabling real-time updates and deeper analysis
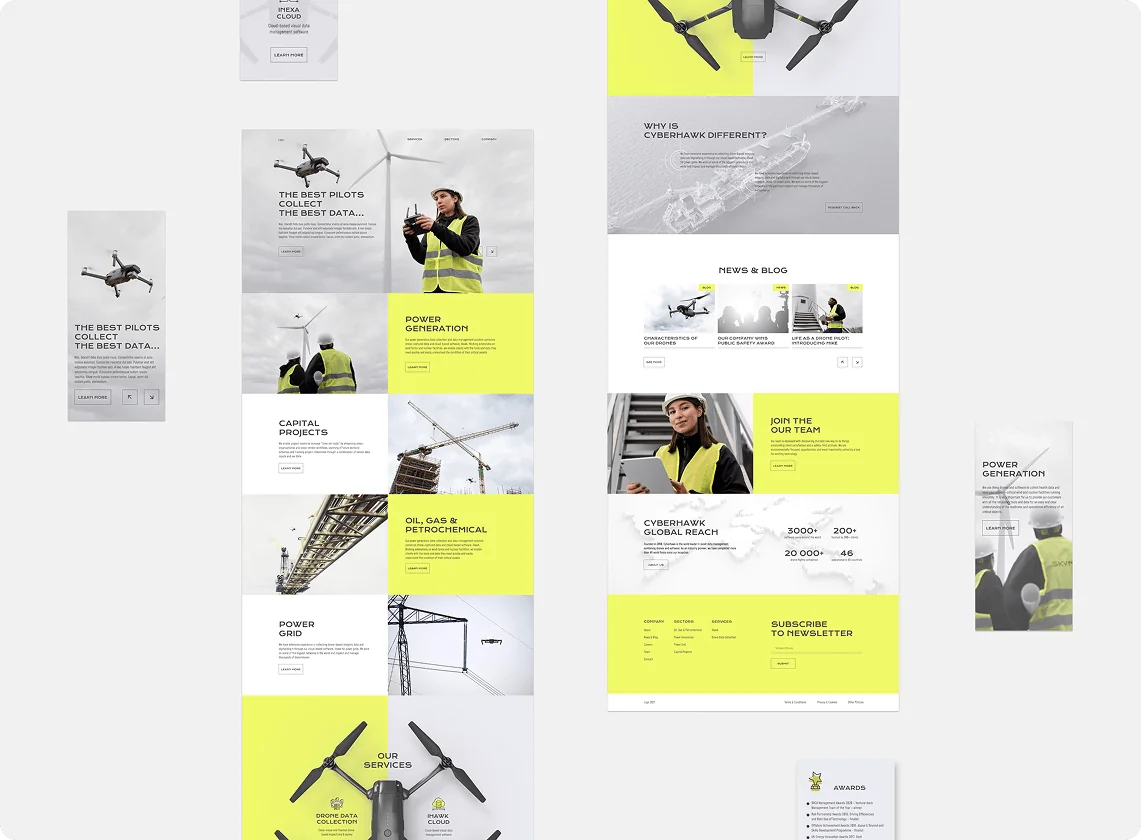
TECHNICAL IMPLEMENTATION
Analyzed how inspection data is collected, processed, and used across different roles
Structured the platform around assets, locations, and inspection layers - not raw data files
Implemented navigation through 2D/3D environments and visual reports
Built a scalable system capable of handling large volumes of visual and sensor data
Connected the platform with tools like HubSpot for operational workflows

WORKING PROCESS
We didn’t design “a website” - we transformed scattered inspection data into a usable product
The focus was not on showing everything, but on helping users understand what matters
Designed for real-world use: fast access, clear hierarchy, minimal friction
Prepared the platform for growth: more assets, more data, more users
Balanced needs of engineers, analysts, and decision-makers in one interface
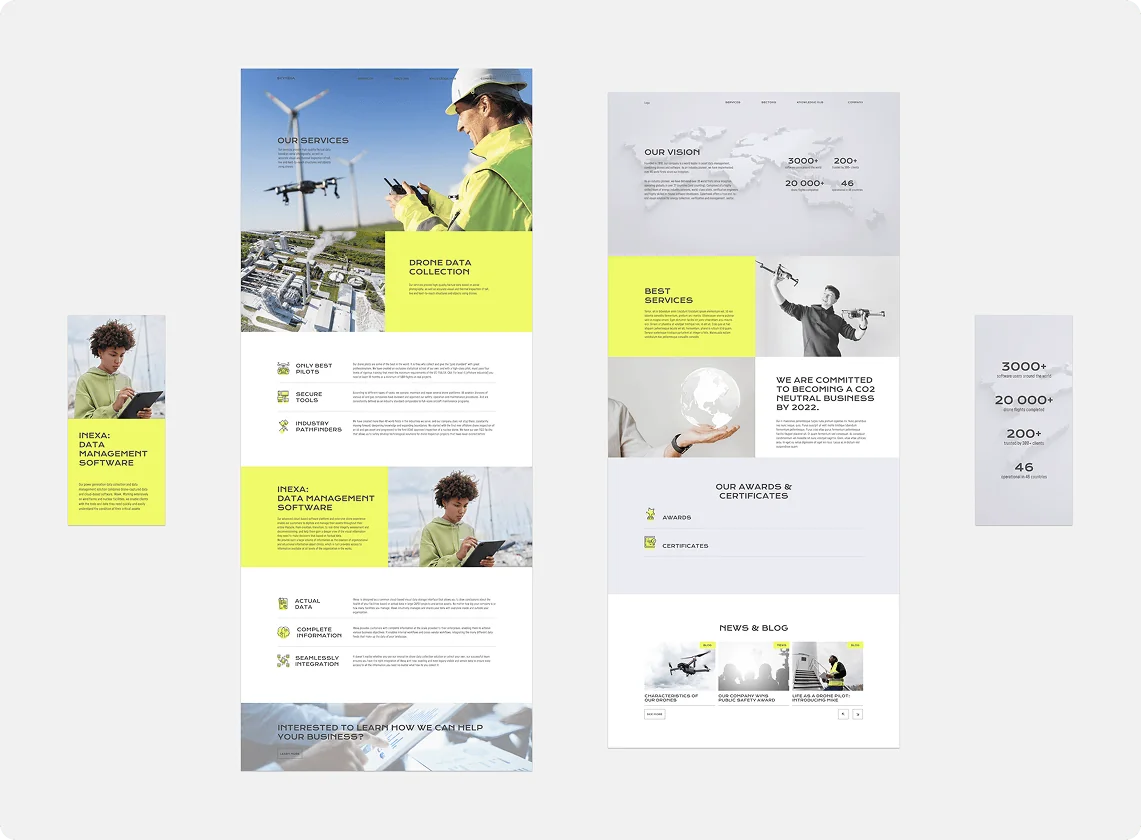
PROJECT RESULTS

Improved decision-making speed through structured visualization of inspection data.
Enhanced collaboration between field engineers and management teams.
Reduced time required to analyze complex infrastructure conditions.
Delivered a scalable infrastructure monitoring system ready for enterprise expansion.
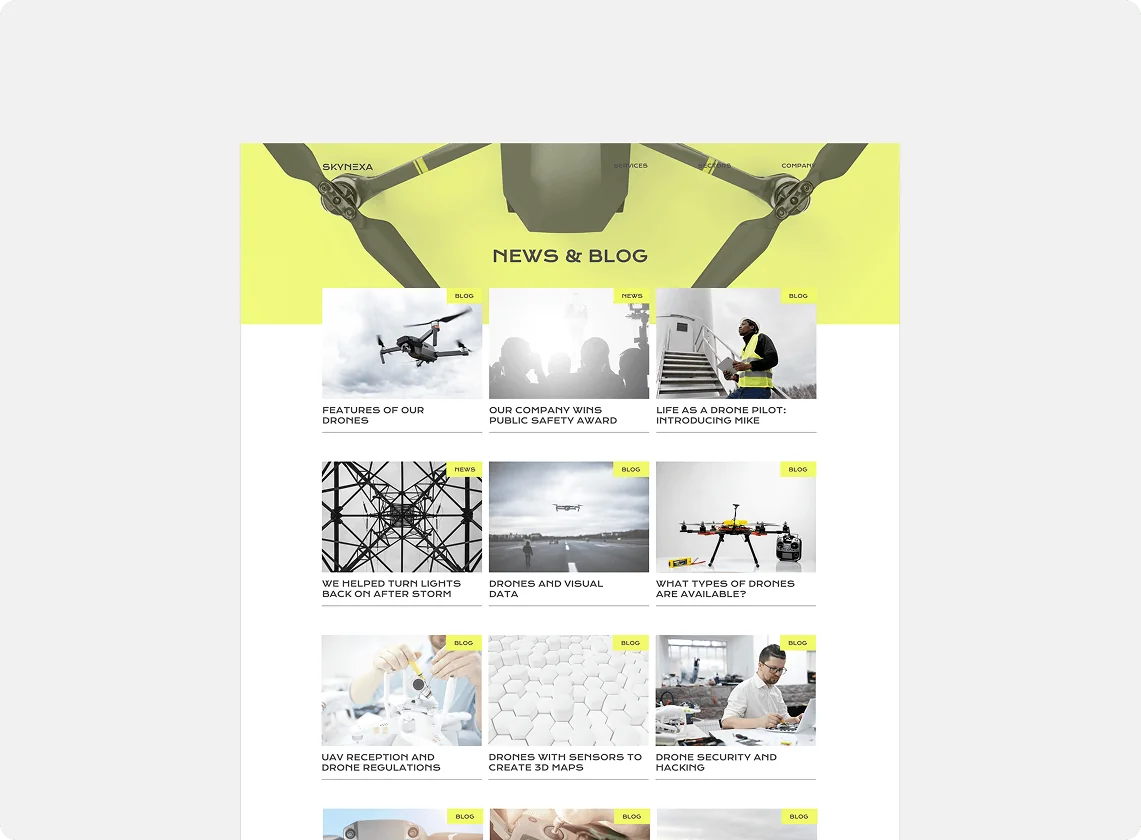
TOOLS WE USE
Design
- Figma
Development
- WordPress
- JavaScript
- HTML5
- CSS3
- HubSpot CRM
Want similar results for your store? Book a free strategy call



Custom Shopify Theme for Luxury Brand